
When we conduct experiments which involve two factors, and it is not possible to obtain repeated measures for a given set of experimental conditions, a two-way analysis of variance without replication may be used.
| ··· | Colj | ··· | Mean | |
| ··· | ··· | ··· | ··· | ··· |
| Rowi | ··· | Xij | ··· | Ri |
| ··· | ··· | ··· | ··· | ··· |
| Mean | ··· | Cj | ··· | M |
where
Hypotheses for Rows
Hypotheses for Columns
Degrees of Freedom
where
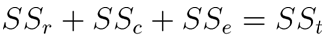
Sum of Squares
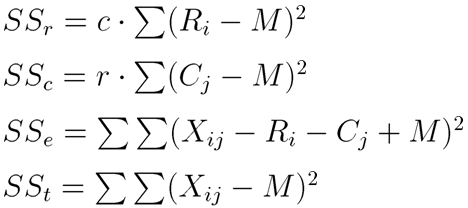
The 4 SS values have the following relation.
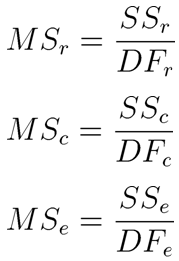
Mean Squares
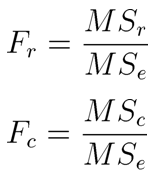
F-values
Critical values
ANOVA Table
| Source | DF | SS | MS | F |
| Row | DFr | SSr | MSr | Fr |
| Column | DFc | SSc | MSc | Fc |
| Error | DFe | SSe | MSe | |
| Total | DFt | SSt |
If the Fr is greater than the F(DFr, DFe, α), you can reject the first null hypothesis. If the Fc is greater than the F(DFc, DFe, α), you can reject the second null hypothesis.
Determine at the 0.05 significance level whether the rows have the different means and whether the columns have the different means.
  ( 45 88 59 )
  ( 64 78 68 )
  ( 72 96 57 )
  ( 67 70 52 )
| Col 1 | Col 2 | Col 3 | Mean | |
| Row 1 | 45 | 88 | 59 | R1 = 64 |
| Row 2 | 64 | 78 | 68 | R2 = 70 |
| Row 3 | 72 | 96 | 57 | R3 = 75 |
| Row 4 | 67 | 70 | 52 | R4 = 63 |
| Mean | C1 = 62 | C2 = 83 | C3 = 59 | M = 68 |
Degrees of Freedom
Sum of Squares
Mean Squares
F-Values
ANOVA Table
| Source | DF | SS | MS | F |
| Row | 3 | 282 | 94 | 0.8571 |
| Column | 2 | 1368 | 684 | 6.2371 |
| Error | 6 | 658 | 109.67 | |
| Total | 11 | 2308 |
Test for Row Means
Test for Column Means