
The Pearson correlation coefficient is a measure of the linear correlation between two variables X and Y, giving a value between +1 and -1, inclusive,
where
The formula for Pearson correlation coefficient is:
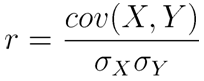
where
The Pearson correlation coefficient can be expressed as:
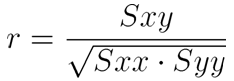
where

or

X: (1 2 3 4 6 7 9)
Y: (4 5 6 5 6 7 9)
We can organize the data set in the form of table:
| No | X | Y |
| 1 | 1 | 4 |
| 2 | 2 | 5 |
| 3 | 3 | 6 |
| 4 | 4 | 5 |
| 5 | 6 | 6 |
| 6 | 7 | 7 |
| 7 | 9 | 9 |
| Sum | 32 | 42 |
From this table, we can find the sample mean:
Here is another table:
| No | X2 | Y2 | XY |
| 1 | 1 | 16 | 4 |
| 2 | 4 | 25 | 10 |
| 3 | 9 | 36 | 18 |
| 4 | 16 | 25 | 20 |
| 5 | 36 | 36 | 36 |
| 6 | 49 | 49 | 49 |
| 7 | 81 | 81 | 81 |
| Sum | 196 | 268 | 218 |
From this table we can find SS values:
Therefore, the Pearson correlation coefficient will be:
From this we can find coefficient of determination (r2):